
18 Ways to Make Your Financial Model Stand Out to Investors
 The median investor looking at your proposal is in her 40s. Her eyes are going, not to mention her brain. I look at a lot of spreadsheets and analytic reports, and way too many are difficult to read and therefore hard to understand.
In an effort to make my life easier, I’ve summarized here the steps that will make it much easier for people to read, understand, and hopefully invest in your business. To help me, I interviewed the two most knowledgeable people I know about financial modeling. My colleague Paul Bianco serves as interim CFO for a number of ff Venture Capital’s portfolio companies and has built and reviewed hundreds of financial models. I also spoke with Michael Hutchens, CEO & Cofounder of BPM Global, which helps organizations more efficiently build and maintain financial models.
Michael first recommends that anyone serious about financial modeling study the Spreadsheet Standards Review Board’s Best Practice Spreadsheet Modeling Standards. My recommendations in this article are focused on making sure that investors understand what you have created. The official Standards are more granular and are the equivalent of programming style: a set of standard methods which help you create an easy-to-use and self-documenting model.
Michael also observes, “One other comment I think would be worth mentioning, even though it seems ridiculously obvious, is the importance of speaking with model users about what is and isn’t important to them when analyzing a model… So often I speak with companies that have charged ahead building an ultra-complex daily or weekly model with thousands of assumptions and complex dashboard outputs, when their potential investors simply want a high-level 24-month forecast with 12 months of reconciling historical data.”
How to make your cells more readable
1) Include a key to abbreviations and terms. While many investors are familiar with terms like DAUs and QoQs, why not make it unambiguous for everyone? In addition, make sure to formally define all terms. E.g., when calculating “Daily Active Users”, does “active” mean “visited the website once”; “performed an engagement action”; or “bought something”?
2) Format your numbers properly. Use commas for all numbers over 1,000; long series of digits are difficult to parse. Use an appropriate number of significant digits. It’s misleadingly precise to have two digits to the right of the decimal in a CAC/LTV multiple for year 3 of your forecast (“Customer Acquisition Cost”/“Customer LifeTime Value”). It’s too imprecise to show only 1 significant digit right of the decimal when showing a $2m topline income statement formatted in millions. All figures should have a denomination, either in its formatting or at least in the column header.
3) Use logical color coding. As a general rule, font coloring is a great way to distinguish constants from formulas, e.g., put your assumptions in blue. You can use fill coloring to distinguish assumptions cells, so that model users don’t inadvertently make changes to formulas and non-assumptions. However, when choosing the font and fill colors to do this, bear in mind that about 8% of all men are colorblind, and many spreadsheets are printed in black and white. Also, you can’t sort datasets by color coding. Hence, different color shades should ideally be readable even to a color-blind person. To ensure this, the official Standards recommend that assumptions sheets use a light grey fill color, and white/no fill for output sheets.
4) Use a minimum font size of 10 points. Font size is the #1 driver of readability. If you have to fit a report on one page, shrink your column sizes and use less white space.
5) Do not use hard black lines to divide rows and columns; they make the page very busy and therefore hard to scan. Instead, use alternating shaded lines or use soft dotted gray lines (suggestion courtesy Edward Tufte).
How to make the entire document more readable
6) Title your file in a format like [Company Name] [Forecast] [yyyymmdd], e.g., “[Company Name] Forecast 20150524″. This allows readers to differentiate your file from all of the other files they receive, and also easily track the evolution of your document as it changes. Naming your file “Forecast.xls” does not make you look considerate or organized.
7) Organize your tabs. When multiple worksheets are used in a workbook, every tab should have a meaningful name, and should read in a logical order left-to-right. One of the marks of an amateur model-builder is using three tabs (the default in a new Excel file), only one of which actually has data.
8) Consistency builds confidence. Given the same calculation logic, the difference between a model that breeds confidence and one that creates anxiety is rigorous consistency. And consistency doesn’t apply only to formats and styles, it applies to every part of a spreadsheet including sheet zoom levels, heading indentation, decimal places, alignment, frozen panes placement, time series columns, etc.
9) Use styles instead of just formats. Spreadsheet applications, like word processing applications, allow styles to be set up once for a spreadsheet and then used throughout. This ensures the consistency of similar content (e.g. headings, assumptions, etc.) without needing to manually format each cell. I think far too few people take advantage of styles in both text documents and spreadsheets.
10) Create an area for assumptions and main drivers at the beginning (top or left) of the model. Jake Perlman-Garr of Datavore points out that this helps facilitate both the auditing and tweaking of forecasts and also helps a potential investor understand better what the entrepreneur thinks are the important drivers of their business. One common option is a dedicated assumptions tab that flows into the rest of the model, and then outputs key pieces of data right at the bottom of the assumptions tab, so that the key inputs and outputs are in one place.
11) Separate out your model output. Some model users will want to stress-test assumptions and explore the detailed calculations throughout a model, but many important decision makers will only want to look at selected outputs (e.g. financial statement summaries, valuation analysis, ratio analysis, etc.) once a model has been finalized. Make this easy for them by creating a dedicated presentation outputs section and positioning it at the front of the spreadsheet.
12) Design for printing. Important decision makers often don’t attend meetings with a laptop, so they’re likely to print key model assumptions and outputs as meeting discussion points. Setting print areas, page breaks and scaling to ensure quick and easy high-quality printing will put you in favor with model users and allow them to impress colleagues with the printed outputs. I recommend inserting report title, date printed, and page number on every footer, for easy auditing.
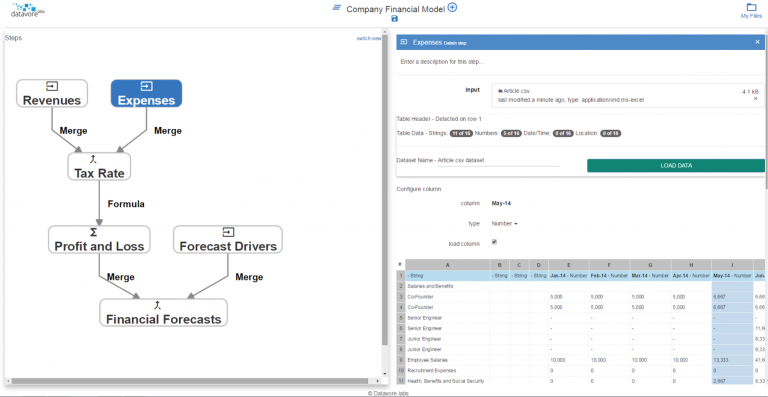
13) Design for auditability. Ideally, create a visual map of the structure of your analysis, so readers can understand the logic of your model. Datavore is a New York startup which is working to improve the functionality of existing tools like Microsoft Excel by creating a visual display of the calculations comprising complex analyses such as a financial model. This allows for easier auditing and if/then testing that flows through each step. Here’s a Datavore sample of a visual summary of a model:
Model should be logical
14) Explain assumptions and make sure they tie to reality. A model that shows X% growth over time with no embedded correlation to sales/marketing is a huge red flag. More reasonable: a company with a direct sales model may drive revenue growth based on the number of productive sales reps and a quota, with a target that is higher over time. If assumptions get better over time (lower customer acquisition, higher gross profit, better retention), note how you plan to achieve those milestones in the model. A more mature organization may project future revenues based on their actual sales pipeline, with a probability adjusted percentage based on stage.
15) Bridge historical and projected data. One of our biggest pet peeves is reviewing an operational model that starts in “Month 1”, and excludes anything that has happened in the past. A model that starts with historical data that flows seamlessly into projected data allows a user to understand how assumptions relate to reality.
16) Cash is king. A model that shows Beginning Cash + Revenue – Expenses = Ending Cash doesn’t tell the whole story. A good model needs to factor in cash collections, disbursements, and other working capital considerations with a Balance Sheet and Cash Flow Statement. While some of your customers may pay via credit card, perhaps some of your largest customers pay on Net 60 or even 90 terms. This is especially important for companies that carry inventory on their balance sheet.
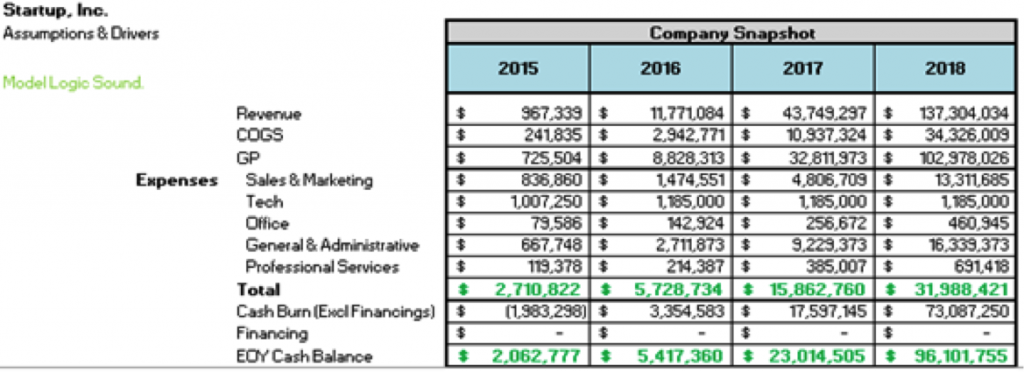
17) Include a sensitivity analysis. While not every model needs to have multiple pre-set scenarios built in, it is useful to see, at a minimum, how changing key assumptions impacts the model outputs in real time. It is particularly useful to see this output directly on the assumptions tab so there’s no need to flip between tabs after making an assumption tweak. Below is an example of a useful financial output summary located within an assumptions tab:

18) Output key metrics, not just financial statements. In addition to summary financial statements, you should include an output of key metrics like acquisition costs, lifetime value, cohort retention, etc.
I suggest also read everything that Edward Tufte has written, and see Hans Rosling’s work for another expert in the visual display of quantitative information. I’ve also written more previously on preparing spreadsheets and financial models.
This post originally appeared on teten.com.

Gust Launch can set your startup right so its investment ready.
This article is intended for informational purposes only, and doesn't constitute tax, accounting, or legal advice. Everyone's situation is different! For advice in light of your unique circumstances, consult a tax advisor, accountant, or lawyer.